Alan Fletcher Version 141027A Oct 28, 2014
The Lugano Paper, Levi et al describes a 32-day test of a new Rossi ECAT.
The temperature of the outer surface is measured using an Infrared camera. From this, the total radiated and convective power can be calculated, assuming that it acts as a Black Body.
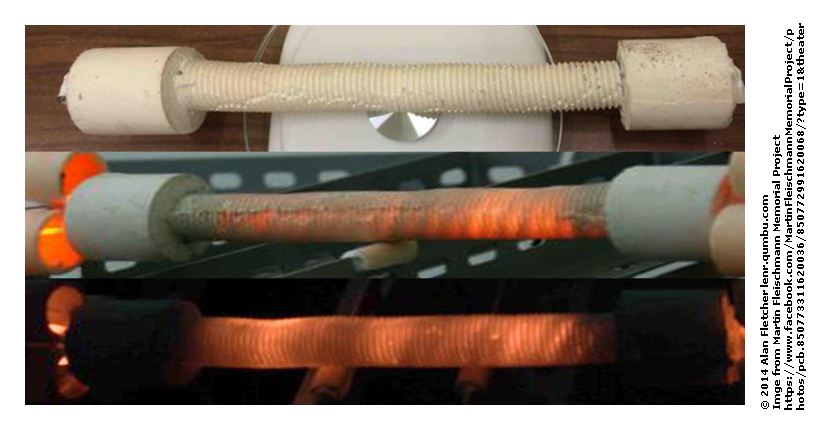
They supplied a few photographs of the hotcat, the central part of which is an Alumina cylinder, with fins (or possibly a spiral), which apparently emits some visible radiation from the inside:
The paper does not identify when these photos were taken, so the claimed temperature is unknown. The experiment was in three parts : a dummy, calibration run at 450C, an active run at an initial 1260C, which was raised to a final stage at 1400C. (Temperatures as calculated from the IR camera).
The main issues raised by these pictures are that the exact emissivity (effectiveness at radiating energy) is unknown, that the "glow" is too "red" for a body at 1260C or 1400C, and that energy may be escaping by transmission, rather than by radiation.
WARNING: all these calculations are based on "representative" parameters, not on the actual ceramic used, so they should be regarded as "qualitative" and not "quantitative").
For a black body the power emitted varies as the fourth power of the temperature according to the Stefan–Boltzmann law:
![]()
where A is the area and "e" is the emissivity (ranging from 0 to 1).
The distribution of power density by wavelength is described by Planck's law:
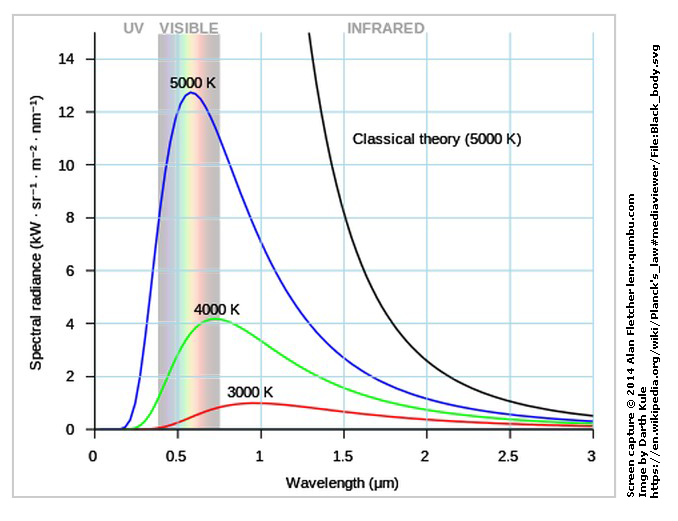
The peak for 1400C is at about 1.8 um.
These calculations depend critically on the emissivity, "e", which is used by the infrared camera to calculate the temperature, and then to calculate the power from the temperature.
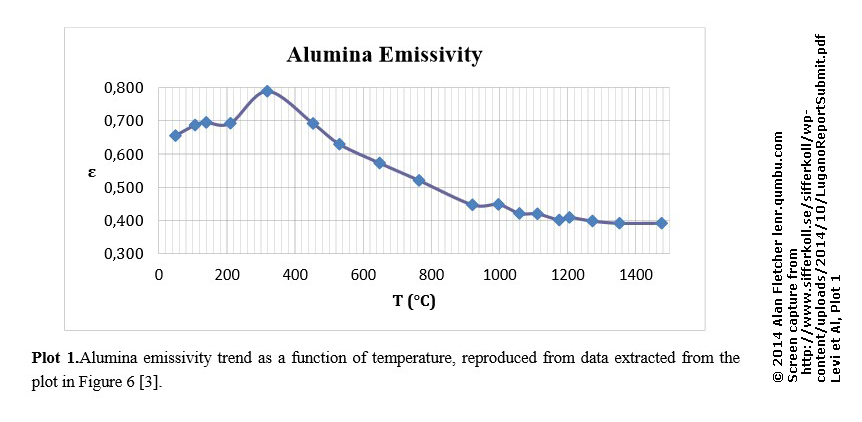
The authors do acknowledge that "e" varies with temperature:
However, they do not take into account the fact that the Alumina cylinder may be transparent at some wavelengths, and that the emissivity itself depends on the wavelength.
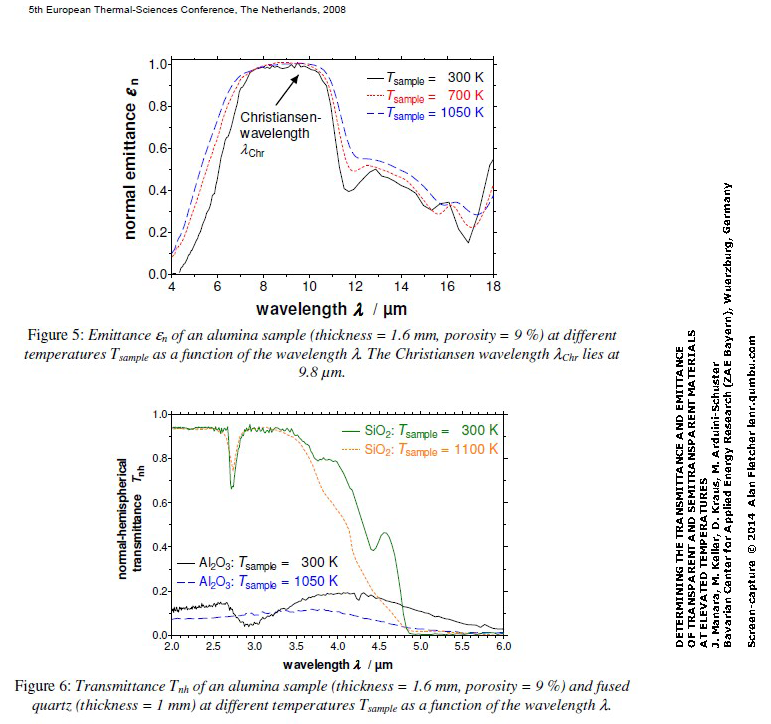
For example, Manara et al analyzed a sample of Alumina, and found that both the emissivity and transmittance depend on wavelength :
In this case the black body power cannot be calculated directly from Stefan-Bolzman. Instead, it must be calculated by integrating the Planck Spectrum e(w)*PS(w) over the range of wavelengths.
The visible range of about 0.4 to 0.7 um is off these charts, but the emissivity is likely to be very low (less than 0.1), and the transmittance at 1050K (770C) appears to be converging to a constant 0.1.
In the Infrared the Optris PI 160 Thermal Imagers work in the range 7.5 to 13 um. Manara Fig 5 indicates a significant deviation of emissivity from the averages used in the Lugano report., and Fig 6 indicates that transmission falls from about 0.1 to 0 between 3.5 and 5.5um, so it is most likely not a factor in the infrared.
Manara fig 5 also shows the variation of emissivity with temperature. It is encouraging to the Lugano report that the shape of the curve does not change much with temperature, so a calibration at 400C might still be valid at higher temperatures.
The black body calculator (described below) was used to calculate the total emissivity of Manara's sample:
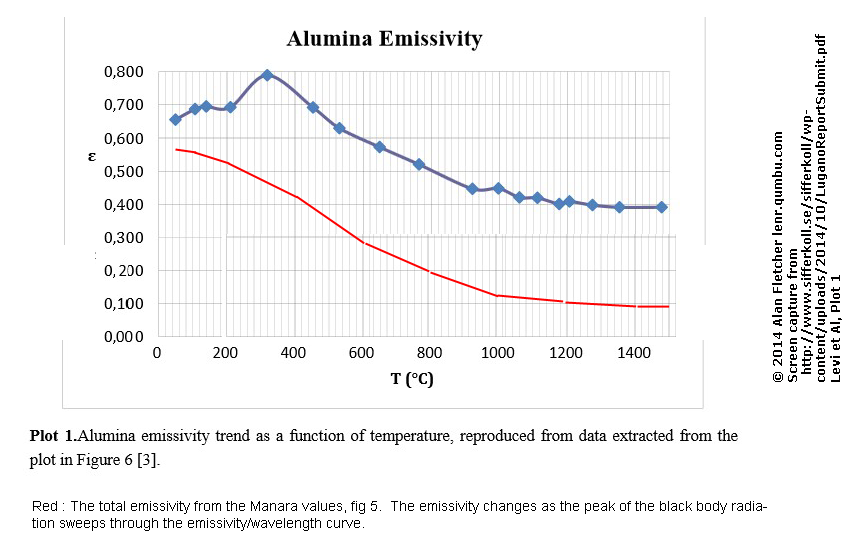
The calculator was run for a range of temperatures, and the average emissivity was calculated as the fraction of Planck power to Stefan-Boltzmann power. The overall shape of the Lugano curve, other than the peak at 300C, is very similar to the Manara curve, so it could also be the result of a wavelength dependency.
A good online calculator is at : Hyperphysics (R. Nave) (I used Nave's javascript functions to generate the tables in this section)
As an example, consider a black body at 777C/1050K (Chosen because we have examples of emissivity from both the Lugano report Plot 1 and from Manara Fig 5).
Temperature 776.85C 1050K
Area 125 cm2
Emmissivity 0.45
From these we can calculate the power radiated from the Stefan-Boltzmann formula :
Stefan-Boltzmann power 387.69103627734376 watts
power = INTEGRATE( e(w)*PS(w) | for w = 0 to infinity) [ other terms omitted for clarity]
e(w) is the emissivity as a function of wavelength, and PS(w) is the power spectrum as a function of wavelength.
The integral can be approximated as a sum :
power = SUM( dw*e(w)*PS(w) | for w = 10 to 10000 by dw ) [ other terms omitted for clarity]
Using this sum of Planck's formula we can see how the power varies with wavelength :
| Results for constant emissivity | ||||
| Step | W-length nm | Emissivity | Power | Percent of SB Power |
| 0 | 100 | 0.45 | 3.3701191393008734e-11 | 8.692796128745109e-12 |
| 1 | 350 | 0.45 | 0.001583137024168244 | 0.00040835017476022076 |
| 2 | 700 | 0.45 | 0.21041059148952268 | 0.054272751186076065 |
| 3 | 1000 | 0.45 | 31.649715790960297 | 8.16364394051116 |
| 4 | 2000 | 0.45 | 86.70861256547578 | 22.36539007918841 |
| 5 | 3000 | 0.45 | 81.15080834835594 | 20.931824766333477 |
| 6 | 4000 | 0.45 | 57.381661641070096 | 14.800873961919716 |
| 7 | 5000 | 0.45 | 38.10976567610258 | 9.829932113478085 |
| 8 | 6000 | 0.45 | 25.32163653759535 | 6.531395923087819 |
| 9 | 7000 | 0.45 | 17.157385061594802 | 4.425530501386385 |
| 10 | 8000 | 0.45 | 11.914167858030357 | 3.073108930356409 |
| 11 | 9000 | 0.45 | 8.479096978567272 | 2.1870758374979693 |
| 12 | 10000 | 0.45 | 6.174520765357374 | 1.592639547368923 |
| 13 | 11000 | 0.45 | 4.591099589721989 | 1.1842160793311816 |
| 14 | 12000 | 0.45 | 3.4783933593228347 | 0.8972075786747067 |
| 15 | 13000 | 0.45 | 2.6800750531626334 | 0.6912914672717323 |
| 16 | 14000 | 0.45 | 2.0963770716330505 | 0.5407339544815678 |
| 17 | 15000 | 0.45 | 1.662204582364325 | 0.4287446514949158 |
| 18 | 16000 | 0.45 | 1.334177962945918 | 0.3441343332971678 |
| 19 | 17000 | 0.45 | 1.0828099330264678 | 0.27929712882292557 |
| 20 | 18000 | 0.45 | 6.187287827482635 | 1.5959326495896633 |
| 21 | 50000 | 0.45 | 0.32092894989280574 | 0.08277956410197262 |
| 22 | 100000 | Total = | 387.69271928120986 | 100.0004341095637 |
| Peak at 2760 | ||||
(Note : the total doesn't quite add up to 100% because of the simple integration algorithm used).
Note : at this temperature (and up to 1400C) the contribution of Black Body power in visible wavelengths is miniscule. So even if the Alumina were completely transparent at visible wavelengths it would not effect the calculation of Black Body power --- and the actual power would thus be larger than the reported power.
However, IF the ceramic had an Emmissivity which varies by wavelength, then (using Manara's data) we would have a different picture:
| Results for Manara fig 5 emissivity (stepped) | ||||
| Step | W-length nm | Emissivity | Power | Percent of SB Power |
| 0 | 100 | 0.01 | 7.489153642890832e-13 | 1.9317324730544692e-13 |
| 1 | 350 | 0.01 | 0.000035180822759294314 | 0.000009074448328004905 |
| 2 | 700 | 0.01 | 0.004675790921989394 | 0.0012060611374683573 |
| 3 | 1000 | 0.01 | 0.7033270175768959 | 0.181414309789137 |
| 4 | 2000 | 0.01 | 1.9268580570105736 | 0.4970086684264093 |
| 5 | 3000 | 0.01 | 1.8033512966301317 | 0.46515166147407716 |
| 6 | 4000 | 0.05 | 6.37574018234112 | 1.6445415513244126 |
| 7 | 5000 | 0.2 | 16.937673633823366 | 4.36885871710137 |
| 8 | 6000 | 0.65 | 36.57569722097106 | 9.434238555571294 |
| 9 | 7000 | 0.92 | 35.0773205703716 | 9.047751247278832 |
| 10 | 8000 | 1 | 26.475928573400765 | 6.829130956347568 |
| 11 | 9000 | 1 | 18.8424377301495 | 4.860168527773267 |
| 12 | 10000 | 1 | 13.721157256349729 | 3.539198994153164 |
| 13 | 11000 | 0.4 | 4.080977413086213 | 1.0526365149610504 |
| 14 | 12000 | 0.5 | 3.8648815103587078 | 0.9968973096385636 |
| 15 | 13000 | 0.5 | 2.9778611701807054 | 0.768101630301925 |
| 16 | 14000 | 0.3 | 1.3975847144220337 | 0.36048930298771187 |
| 17 | 15000 | 0.3 | 1.1081363882428836 | 0.2858297676632773 |
| 18 | 16000 | 0.2 | 0.5929679835315191 | 0.15294859257651905 |
| 19 | 17000 | 0.4 | 0.9624977182457488 | 0.24826411450926705 |
| 20 | 18000 | 0.4 | 5.499811402206793 | 1.418606799635258 |
| 21 | 50000 | 0.4 | 0.2852701776824931 | 0.07358183475730877 |
| 22 | 100000 | Total = | 179.21419098832735 | 46.22603419185641 |
| Peak at 2760 | ||||
In other words, the total power actually emitted MIGHT be significantly different from the nominal value.
WARNING : these calculations are for example only, and do NOT apply directly to the hotcat. Do NOT quote this result as "proof" that the hotcat didn't produce the reported power.
A lot of the talk on the intertubes revolves around the general use of an IR camera for the temperature measurement and power calculations.
In my opinion they might have been better off using a "fatcat" (as is used in the 1MW system) with water-only calorimetry.
McKubre (one of the best experimentalists in the trade) appears to have no fundamental objection to IR calorimetry, though he is very concerned with the lack of calibration at the operating temperature, and thus appears to rate the whole experiment as inconclusive.
Is there evidence of excess heat? My impression is “Yes” (but see below). Is this evidence unambiguous? Not as presented. ..
The calibration that was performed was at a single point well below the points of ultimate operation. This is bad and bad. We need to determine the shape of the performance manifold empirically, ideally bracketing all points of operation. This was not done. ...
The inability or unwillingness to do one or all of these things [calibration] is a glaring deficiency in the thermal output record. That is not to say that this record is incorrect, but we cannot be certain that it is correct and the measurement uncertainty is undefined. ..
On the whole I am encouraged. Considerably more work is obviously needed to validate the adopted mode of calorimetry and support better sampling and testing. But we are given something we can sink our teeth into both experimentally and theoretically: testable fuel to products nuclear burn at temperatures that have practical, economic and social potential.
However Gordon Docherty makes a strong case for the use of IR calorimetry:
October 9, 2014 at 11:34
In reply to “the Pathoskeptic camp”, and their complaints about using thermal imaging that I have seen elsewhere.
If you used any form of direct contact, it would immediately be claimed:
1. the direct contact was used to pump energy into the system
2. the direct contacts were measuring hotspots, and were not at all representative
3. loose contacts were giving false readings or, if in direct contact, the characteristics of the measurement devices moved “out of band” as the high heat invalidated use of device
4. results from the measurement system cannot be trusted, as the system’s characteristics change as the measurement system heats up
5. the measurements were being fiddled anyway (for example, by hidden equipment somewhere along the wires)likewise, if a liquid was used, and measured, it would immediately be claimed:
1. all of the above for direct contact plus:
2. the assumptions about flow rate are wrong
3. not enough steam (remember that one!)
4. the probes measuring the liquid (or steam) temperature were in the wrong place
5. the liquid contained impurities
6. need to run the e-Cat at very low temperatures, to raise water temperature from ambient to, say, 60 degrees – at the same time, of course, claiming the ambient temperature was incorrectly measured, so invalidating the claimed (small) difference between ambient and system temperatures.Thermal imaging, while not “perfect” (nothing is):
1. cannot be used to pump energy into the system
2. provides a view across the whole piece (and, indeed, tends to underestimate, not overestimate), so avoiding the charge of measuring hotspots
3. by (calibrating) and using more than one thermal camera, “single points of failure” in the measurement system are ruled out.
4. cameras are physically decoupled from the system being measured, so impacting least on the system being measured
5. with (known temperature) calibration points and one of the cameras being mobile, measurement error (uncertainty of measurements) can be much reduced, even when the background temperature fluctuates
6. means the measuring equipment remains cool (again, decoupled) – not the case otherwise
7. records raw data – that means any measurement adjustments made after the fact are transparent and well understood. Ultimately, there is always the raw data to go back to.So, thermal imaging was definitely THE BEST CHOICE for measuring the heat being put out by the system (running at 1400 degrees) – with a (very conservative) COP of 3.2 – 3.6, “rounding errors” can also safely be discounted.
Also, the selected Optris camera may not be the best for this task. An interview with of Richard Skogfeldt of Williamson indicates that their spot pyrometer (which can also be used to scan an area) would not only have given a more accurate reading, but would have calculated the emissivity in the process. Skogfeldt points out that measuring Alumina is difficult, because the reflectivity, transmission and emissivity all vary by temperature and wavelength, and are different for different samples.
Unfortunately at the critical point they were talking over each other. My interpretation is that it would have been better to do the measurement at 2.5u, near the peak of the black-body radiation, and not in the 7-15u band used by the Optris.)
The Lugano team say that they measured all the electrical inputs correctly, using appropriate meters.
However, Ethan Siegel still includes a "wiring fake" as an explanation. (Though that's for a single-phase connection : what would a 3-phase fake look like?) So : who provided the cord between the building supply and the "upstream" meter? Rossi (possible fake), or the experimental team? If Rossi, they could have cut the cable at the end of the experiment (as Defkalion offered to do.) Since this fake was identified in 2011, why didn't they address it in 2011, 2013 or 2014?
They include visible-range photos, but do not indicate at what points of the experiment they were taken.
They provide a single IR image, during the calibration phase, but none from the active stages.
The published report was obviously cut down to a minimum length (45 pages) in the hopes of publication.
The situation could possibly be corrected by posting a long version, including a second-by-second account of Rossi's involvement, and details of the calorimetry at identified stages of the experiment.
Even if the Alumina were completely transparent at visible wavelengths it would not significantly effect the calculation of the temperature or of the Stefan-Bolzman Black Body power --- and the actual power would thus be larger than the reported power. Since the visual photographs of the hotcat were at unknown times, with an uncallibrated camera (white balance), discussions of "color temperature" cannot be used to deduce anything.
The power calculation of the hotcat depend strongly on the emissivity used:
In short, because the actual emissivity of the Alumina tube may differ greatly from textbook examples, the output power may not be calculated correctly.
The experiment was calibrated at 400C, but this is too far from the operating point, and they were unable to mount a thermocouple on the cylinder to get an independent reading.
Samples of the cylinder were sent for molecular analysis, confirming that it is Alumina. A sample should have been sent for calibration of its emissivity.
I therefore rate the Legano Report results as "inconclusive".
IF they had simply filed off a small flat area on the cylinder and correctly mounted a thermocouple, then they could have calibrated the whole experiment for temperature, and the results would have been more conclusive. Whether they asked Rossi to do this and he declined, we don't know.
For want of a nail the shoe was lost;
For want of a shoe the horse was lost;
For want of a horse the battle was lost;
For the failure of battle the kingdom was lost—
All for the want of a horse-shoe nail.
In another paper Manara reports that existing IR systems are inadequate for high temperature ceramic systems, which may be semi-transparent. They present results from a new system which analyses data from 2um to 20um and can be used up to 1600K. This is, of course, the operating range of the hotcat.
This document may be quoted, copied or translated, with the following copyright notice:
© 2014 Alan Fletcher lenr.qumbu.com
Images may only be copied WITH the annotation of where they came from.