eCat Steam Calculator

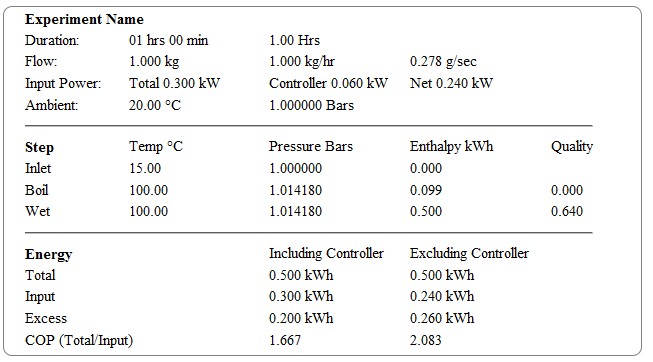
This program calculates and displays results from eCat experiments.

Blank Template
Selected examples

Control Panel

These control buttons are always visible. The rest of the control panel can be hidden.
Zoom:  :  Send Labels :
 Zoom : If set, plot the specified window
Send Labels: Shows regions of the TH plot.
  Plot Equal Pressure Lines :
 If Atm is checked, uses the Ambient pressure E0
Name:
Duration: hrs min sec = 1.0000 Hours
 Results are scaled to 1 hour, for the given flow
Input Flow: kg (Liters) = 1.000000 kg/hr = 0.277778 g/sec
Input Power Total: kW Controller: kW
 If set, the controller power will be subtracted from the total power
Output Power Total:
 
  Select Output Power by kW,Steam Quality or Superheated
 kW : the path will be followed until the specified power is reached
Quality : the power will be set to produce steam of a quality between 0 and 1
Superheated : the power will be increased to produce steam at the specified temperature and pressure.
All of these start at the inlet temperature E1 and go through the specified boiling point E2
     
Path Pressure (Bars)
(Std atmosphere = 1.01325)
E0: Ambient
  The ambient pressure is used to plot equal-pressure lines in Atm.
E1: Inlet
E2: Boil
  Select Boiling Point by Temperature or Pressure

Link:
Make the long URL tiny:
Optional custom alias -- may contain letters, numbers, and dashes.
Use this section to obtain the link address, the HTML code, or a TinyURL. The latter allows you to specify your own URL (if it is available).

Temperature-Enthalpy Plot

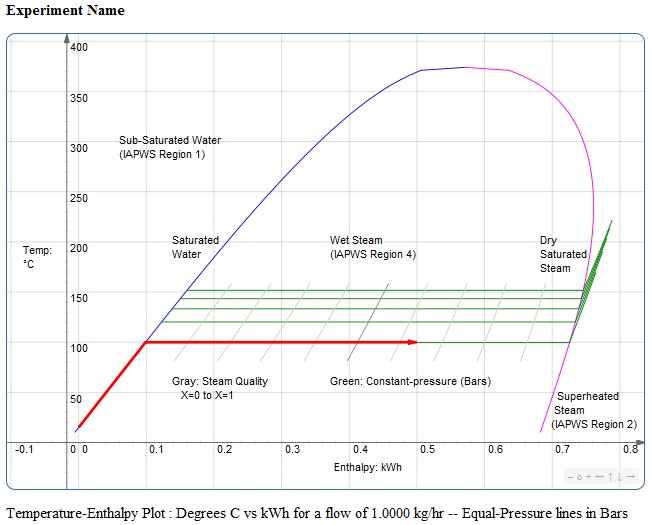
This is a plot of Temperature vs Enthalpy -- effectively the Energy in kWh required to reach a specified point.

It is scaled to 1-hour duration, and to the input flow. A specific "path" is highlighted in red.

The region labels can be turned off, and the graph can be zoomed.

Note: The jsxgraph plotting software allows the displayed graph to be zoomed (eg with the mouse scroll wheel) and panned (using the controls at the bottom-right) -- but these do not always produce a useful display. For instance, the axes will not always show. It is therefore recommended that you use the "Zoom" feature in the control panel.

Results Panel

Use

All of the values set in the Control Panel are sent as arguments with the URL, so it is possible to "share" results.


eCatCalc Version d :  © 2014 Alan Fletcher lenr.qumbu.com
Javascript Graphing software by JSXGraph
Javascript Steam Calculation functions by Leon Kos, University of Ljubljana